...
Contains many important findings. here are just two
1. New estimates of labour productivity suggest that changes in the
aggregate mix of activity in the UK economy – as well as lower
productivity growth in telecommunications, manufacturing and finance
industries – account for a large proportion of the UK’s recent
productivity slowdown.
2. Experimental estimates indicate that current price investment in
intangible assets was £134.2 billion in 2015, compared with £141.7
billion for investment in tangible assets over the same period; this is
the first time since 2000 that investment in tangible assets has been
higher than investment in intangible assets
In turn.
1. Industries and industry mix.
in this release we have extended the time series of our detailed-industry labour productivity dataset back to 1997.
These data include labour productivity data for 66 different industry
groupings and for around 50 “division” level industries from the
Standard Industrial Classification 2007: SIC 2007
There's a lot of within industry heterogeneity
Figure 1 shows the annualised compound average growth rates of labour
productivity between Quarter 1 (Jan to Mar) 2009 and Quarter 1 2017, for
both industry sections (an aggregated industry breakdown – the bars),
and the lower, division-level components of those industries (the
points)
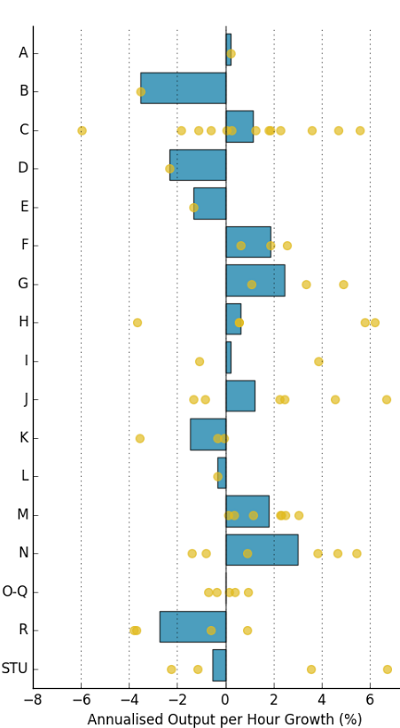
A: Agriculture, forestry and fishing; B: Mining and quarrying; C:
Manufacturing; D: Electricity, gas, steam and air conditioning supply;
E: Water supply, sewerage, waste management and remediation activities;
F: Construction; G: Wholesale and retail trade; repair of motor vehicles
and motorcycles; H: Transportation and storage; I: Accommodation and
food service activities; J: Information and communication; K: Financial
and insurance activities; L: Real estate activities; M: Professional,
scientific and technical activities; N: Administrative and support
service activities; O-Q: Public administration, defence, education,
human health and social work activities; R: Arts, entertainment and
recreation; and STU: Other service activities; activities of household
and extra-territorial organisations and bodies.
Which industry is the largest contributor? This is interesting:
growth in whole economy labour productivity can be decomposed into
contributions from each industry – reflecting the effect that
productivity growth within an industry has on the UK’s aggregate
performance – as well as an allocation effect. This allocation effect
captures changes in the mix of different industries in the UK economy
overall, in terms of both shares in value added and shares of labour
input. For instance, if the share of labour input used by a
low-productivity (high-productivity) industry increases through time at
the expense of high-productivity (low-productivity) industries, then the
UK’s aggregate performance will weaken (strengthen), independent of the
growth rates of productivity within specific industries. In other
words, productivity in each individual industry could increase, but
overall productivity could still fall if sufficient labour moved from
higher to lower productivity industries.
By comparing the contributions to labour productivity growth of specific
industries prior to the downturn with the equivalent contributions to
growth following the downturn, the change in contributions can be used
to help explain the slowdown of whole economy productivity growth. This
is shown in Figure 2, which uses the new, longer time series of labour
productivity to compare contributions to growth in the five years to
Quarter 3 (July to Sept) 2007 (the light points) with contributions to
growth in the five years to Quarter 3 2017 (the dark points). The
differences between these points are shown as bars and these represent
the change in the contribution of each industry to aggregate labour
productivity growth over this period. Industries are ordered from those
whose contribution increased the most, to those whose contribution was
most reduced. The same is also done for the allocation effect. To
highlight the important results, only the top 10 and bottom 10
contributors are shown
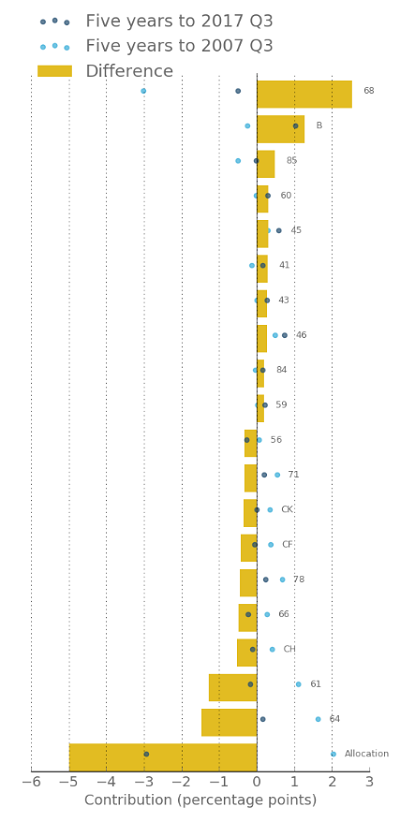
Notes: 68: Real estate activities; B: Mining and quarrying; 85: Education; 60:
Programming and broadcasting activities; 45: Wholesale and retail trade
and repair of motor vehicles and motorcycles; 41: Construction of
buildings; 43: Specialised construction activities; 46: Wholesale trade,
except of motor vehicles and motorcycles; 84: Public administration and
defence; compulsory social security; 59: Motion picture, video and
television programme production, sound recording and music publishing
activities; 56: Food and beverage service activities; 71: Architectural
and engineering activities; technical testing and analysis; CK:
Manufacture of machinery and equipment n.e.c.; CF: Manufacture of basic
pharmaceutical products and pharmaceutical preparations; 78: Employment
activities; 66: Activities auxiliary to financial services and insurance
activities; CH: Manufacture of basic metals and metal products; 61:
Telecommunications; and 64: Financial service activities, except
insurance and pension funding.
So it turns out that reallocation is the biggest contributor.
Firstly, at this level of detail1, the allocation effect
accounts for 5 percentage points of the 7.1 percentage points slowdown
in productivity between the two periods. This means that changes in the
mix of industries in which individuals are employed accounts for the
largest proportion of the slowdown in growth in recent years. Rather
than adding to labour productivity growth as it did over the five years
to Quarter 3 2007, the allocation effect held back output per hour
growth over this period.
Secondly, the slowdown in measured productivity
growth in several industries plays an important role in explaining the
slowdown in the UK’s aggregate performance in recent years. In
particular, the telecommunications2, finance, and manufacturing industries made considerable contributions over this period.
The allocation formula is hard to find, it is in this
information
note (thanks to ONS for providing this).
And says that the reallocation effect is the sum of (a) the movement of labour to above- or below-average industries and (b) the covariance between productivity growth and labour share growth. Notice that the allocation effect was positive before the great recession and negative afterwards.
more details on this are found here. My reading is that there has been a collapse in the labour effect, that is, much of the reallocation problem seems to be a a fall in the extent to which labour is flowing to high productivity industries.
 This below diagram is figure 9 from https://www.ons.gov.uk/employmentandlabourmarket/peopleinwork/labourproductivity/articles/divisionlevellabourproductivityestimates/january2018#the-effect-of-reallocation-on-output-per-hour-growth.

