Monday 22 May 2023

What is chain drift?

 A nerdy blog. 

1. many goods have lots of variation in prices e.g. with sales

2. suppose, says Eriwn Diewert in Scanner Data, Elementary Price Indexes and the Chain Drift Problem

Revised October 13, 2021 we have the following data where good 2 is never on sale, but good 1 is and gets a massively changing set of quanties, rising in the time, then returning, but importantly, not instantly, to initial quantities


3. beccause the post sale adjustment, plausible if, for example, its a durable good, is slow, chained weights do not return back to initial levels. 

4. the table below shows "Table 2 lists the fixed base Fisher, Laspeyres and Paasche price indexes, PF(FB), PL(FB) and PP(FB) and as expected, they behave perfectly in period 4, returning to the period 1 level of 1. Then the chained Fisher, Törnqvist-Theil, Laspeyres and Paasche price indexes, PF(CH), PT(CH), PL(CH) and PP(CH) are listed. Obviously, the chained Laspeyres and Paasche indexes have chain drift bias that is extraordinary but what is interesting is that the chained Fisher has a 2% downward bias and the chained Törnqvist has a close to 3% downward bias."


Monday 17 April 2023

GDP and health: stocks, flows, output and outcomes

 Interesting discussion at Imperial today.  

1. The health of a nation can be thought of as an outcome (e.g. premature death) and/or a stock (the number of heavy smokers) and/or a flow (number of operations performed per year). 

2. GDP is a flow.  It is the flow of output via people purposefully employed in producing that output flow.  It isn't outcomes.  So a healthy society via social norms or parents helping their children produces an outcome but not an output.  The output of health is operations done, patients seen.  Which can of course be measured better.

3. Missing markets.  Well, people at home are producing things as well.   Not only with modern working from home, but reading to children, looking after family all of which produces a flow of services.  But, we don't typically have that included in GDP since we don't know what price to allocate to that activity, since it's not an activity that's sold in the market.  We could make some assumptions e.g. by taking the market price of a carer working for a care home but typically we don't do this. 

4.  So, GDP doesn't necessarily measure well-being.  

5. In our Indigo Prize essay we explain more on GDP as a flow, adding up the flow of iPads, pencils and 737s, and going beyond GDP.  And the ONS produces a dashboard of health outcome indicators

Saturday 4 March 2023

Policy-making under uncertainty: a case study

 A column by Megan Greene, FT, Dec 2 2021 reminds me of the omicron situation in Winter 2021.


November 30, 2021


The chief executive of Moderna has predicted that existing vaccines will be much less effective at tackling Omicron than earlier strains of coronavirus and warned it would take months before pharmaceutical companies could manufacture new variant-specific jabs at scale.

November 30th 2021

[Mr.Sahin is]...refusing to panic about the spread of Omicron, its newest variant. “I am personally not scared about the situation. We expected such a variant to come,” Ugur Sahin told The Economist in an interview. He is co-founder and chief executive of BioNTech,

December 1st 2021

Vaccines will likely protect against severe Covid-19 cases from the new omicron variant...WHO chief scientist Soumya Swaminathan said


Monday 21 February 2022

Prospects for business investment

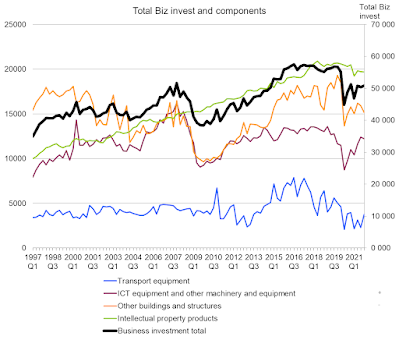
 The latest ONS business investment data, chained volume indices show 


What do we make of this? 

1. Overall investment took a beating in the financial crisis, then recovered. But it stalled again post the 2016 Brexit referendum.  It collapsed in the pandemic, and has not recovered.

2. The lack of recovery is mainly due to the fall in buildings, which has hardly recovered at all. 

3. IPP and ICT investment has stayed flattish and recovered respectively.

4.  Transport equipment, which is very volatile anyway has continued on a downward trend.  

5. Over the longer term, the constant is rising IPP investment.  ICT investment is not even back to pre-financial crisis levels. Buildings is back to 1997 levels. 

Wednesday 13 October 2021

Friday 28 May 2021

Explanations for low productivity growth: some history

As this paper nicely points out,  Shimaa Elkomy et al, "Energy and Productivity, A review of the literature" https://cusp.ac.uk/wp-content/uploads/pp-energy-report.pdf#ppem, the explanations seem to be rather the same: 


"For example, in 1966 Cambridge economist Nicholas Kaldor pointed to (and rejected) a number of common explanations for the UK’s declining productivity growth. Many of these reappear in the UK government’s recent industrial strategy (Table 2). Either we have made little progress in tackling these issues in the intervening half century, or we have missed a key element of productivity"


Kaldor, N. (1966) Causes of the Slow Rate of Economic Growth of the United Kingdom: An Inaugural Lecture. Great Britain: University of Cambridge Press

BEIS (2018) Industrial Strategy: Building a Britain Fit for the Future. Available at: 78 | CUSP WORKING PAPER No 23 https://assets.publishing.service.gov.uk/government/uploads/system/ uploads/attachment_data/file/664563/industrial-strategy-whitepaper-web-ready-version.pdf (Accessed: 29/04 2018)

Wednesday 12 May 2021

Has Globalisation Slowed Down

 Happy to have done a Tuck/Dartmouth college panel on this.  Here's some data from Pol Antras on "slowbalisation" https://scholar.harvard.edu/files/antras/files/deglobalization_sintra_antras.pdf


a.       "The world trade‐to‐GDP ratio – a standard measure of globalisation – has recovered from its late 2008 low, while last year, the share of migrants in world population attained its highest level since 1990

b.       Concerning the ratio of world trade to world GDP in the last fifty years, 1970-2020

                                                               i.      The ratio of world trade to world GDP almost doubled (increasing by a factor of 1.72) during that period of “hyperglobalisation”.

                                                             ii.      I find that 80% of the growth in this ratio occurred during the subperiod 1986‐2008. (Why? Combination of ICT, fall of communism, China, shipping costs falling)

                                                           iii.      Because many measures of globalisation are simple ratios or shares that have natural upper bounds, I argue that growth explosions in trade openness of the type experienced during the hyperglobalisation of 1986‐2008 are simply not sustainable. In other words, a period of “slowbalisation” was inevitable."


Here's his figure 1


Tuesday 2 February 2021

Pass Through

 This 2014 paper on cost pass-through is a nice summary.  


Our discussion of relevant theory is framed in terms of absolute pass-through: the degree to which a given absolute change in cost causes an absolute change in price

The extent of industry-wide cost pass-through in a perfectly competitive market depends on the elasticity of demand relative to supply. The more elastic is demand, and the less elastic is supply, the smaller the extent of pass-through, all else being equal


With other market structures, economic theory indicates that: 

– Pass-through depends on the curvature of demand. It is greater with convex inverse demand (the inverse demand curve becomes steeper as output decreases) and smaller with concave inverse-demand (the inverse demand curve becomes flatter as output decreases), all else being equal. 

– Pass-through is smaller when marginal cost curves slope upwards (i.e. marginal cost increases as output increases) and greater when marginal cost curves slope downwards (i.e. marginal cost falls as output increases). 

– Pass-through in excess of 100% is possible when inverse-demand is convex enough and/or when there are strong increasing returns to scale such that marginal cost curves slope sufficiently downwards. Industry-wide cost increases can result in increased profits when demand is very convex.

Many theoretical models indicate that pass-through of industry-wide cost changes increases with the intensity of competition1 , provided that inverse demand is not very convex,

The paper usefully illustrates some examples of industry curvature.


"Suppose that a monopolist faces an increase in its unit costs. The monopolist will consider its scope to adjust its price upwards. 

The monopolist will think: “how much output do I have to sacrifice to pass on a certain amount of this change in my costs?” If the answer is “very little”, passing on the cost shock will be more attractive; if the answer is “a lot”, passing on the cost shock will be less attractive. The answer to the monopolist’s question is related to the curvature of demand. Other things being equal, pass-through will be lower if inverse demand is concave (because passing on the cost increase will cause a relatively large fall in output). On the other hand, pass-through will be higher with convex demand (since passing on the cost increase has a smaller impact on volumes)."

A useful formula in Genakos, 2019, summarises this. 


where 

  • rho is the impact of an incrase in marginal cost on price
  • theta is price marginal cost margin times product demand elasticity, an intensity of competition index (theta=0 competition, theta=1 monopoly)
  • es the elasticity of supply 
  • ems is the curvature of demand (strictly the curvature of log demand). 
  • etheta how intensity varies with quantity


special cases
  • theta=0, 
  • MC=constant, ed-theta/es = 0; demand linear ems=1, then rho=1/1+theta and so more monoply means less pass-through. 


Monday 30 November 2020

Supply chains and the UK productivity puzzle: a framework

An interesting Productivity Institute meeting today on supply chains. 

One of the features discussed about the UK productivity puzzle is under the heading of “supply chain management”.  Maybe British supply chain productivity is very low. Maybe British supply chain productivity is not resilient enough, see COVID and issues around Chinese involvement in 3G technology for example.  so how should we think about supply chains? How should we answer questions about whether supply chain management is or is not adequate?

Let's start with an example.  Suppose we have three types of law firms.

1.     Law firm 1 employes a building, a receptionist, an operations manager, and a load of lawyers.  The process within the law firm consists of the following.  The client comes into the building and is greeted by the receptionist who then takes the client up to the lawyer.  The lawyer gives the client an opinion , and the client pays and walks away.  The operations manager designs the process by which the receptionist takes the client up to the lawyer (offering them tea, helping with directions to the next appointment etc.)  Notice, the client never sees the operations manager, and although the client sees the receptionist, neither the receptionist nor the ops manager is a trained lawyer.

2.     We then have some definitions as follows:

a.      Industry.  the law firm is in the law industry because its output is legal services.

b.     Process. The visible processes which the law firm is involved in consists of the process carried out by the receptionist and the process carried out by the lawyer.

c.      Activity.  The law firm is in fact involved in three different activities:

                                                                         i.      the provision of reception services,

                                                                       ii.      of operations services ,

                                                                    iii.      and legal advice. 

d.     Lots of the lawyers in law firms moan endlessly about the fact that out of their fees comes the expenses of the receptionists and the operations managers, none of whom know anything about the law. Likewise academics who complain about administrators and admission staff who know nothing about academia, footballers who complain about groundstaff who can't play football etc.

3.     now consider law firm 2. They have contracted out reception services to a separate firm, who has simply bolted a flat screen TV screen to the wall of the front office and provides receptionist services remotely.

4.     Now consider law firm 3. They have also contracted at reception services, but they as well they have contracted out operations management to a management consultant. the management consultant as supplied them with the book setting out a set of routines to which, let us say, the receptionist adheres, when taking the client up to the lawyer.


What can we say about productivity and the adequacy or otherwise of supply chain management in these examples?

1.     Let's start with the definition of a supply chain. Law firm one has an entirely internal supply chain, in this case the process by which the receptionist hands over the client to the lawyer. That supply chain is presided over by the operations manager.  Law firm three has a supply chain, but it is external. That is to say, the services provided by the receptionist and by the operations manager in simply bought in externally.

2.     Going back to the activities that are involved, in firm one the operations manager provides operations advice services, but this is done internally. If one had the management accounts for this firm, and one could figure out the wages and overhead costs of the operations manager, one could therefore figure out the costs involved in the provision of those advice services. In case 3 the matter is much easier; one just looks at how much the firm is paying to the management consultant.

3.     What about measuring productivity? there would seem to be two methods:

4.     method 1.  Process.

a.      In law firm one, break up the firm into the different processes that are involved. Try to measure the productivity of each process. So there will in practise be two output measures; first, the output of the reception process, and 2nd the output of offering legal advice after the client has been through the process of reception.

b.     In this case, one would have to try as well to allocate costs such as the operations manager into each process. This of course it's much easier to do in the case of law firm 3 since every part of the process is transacted for. Thus there is going to be an observable price and quantity for the entire provision of legal advice.

5.     Method 2.  Activity.

a.      For every law firm count the output as the provision of legal advice, so there is only one measure of output. However, account for the fact that different law firms undertake different activities, and these activities might potentially contribute to productivity. In each of the examples the activities are (a) reception activities, (b) giving-legal-advice-activities, and (c) operations activities.  

b.     Although measuring the activities is hard, by taking an activities rather than a process approach, one avoids the almost impossible problem of subdividing the output of legal advice into lots of different processes.  Indeed, in many law firms , who keep time sheets of chargeable hours, it might very well be feasible to gather data on the activity, because it is the different activities that are documented on the charge sheets (for example many charge sheets might categorise the activities of being with clients, marketing and customer acquisition, personnel and administration). 

c.  This activity approach would, under certain circumstances, count the knowledge of the ops manager as an intangible asset.  For more on intangibles, see here

6.     (Finally, an overall point on the economic modelling of all of this.  As Milgrom, Roberts and others Have pointed out, economists have a very stripped down model of the firm. When economists write down what is called a production function, they assert, on the face of it quite sensibly, the output is produced by capital and Labour. What many supply chain managers and the academics who study them will tell you is that production requires as well coordination activities. Economists tend not to bother modelling these coordination activities separately. They are either included in labour, or viewed as being small enough for one to ignore.)